
One of the exciting and time saving features for diagnosing issues in Visual Studio 2015 is IntelliTrace. This allows to perform historical debugging by recording the events generated by your application. In this post we will see how easy we can enable IntelliTrace in Visual Studio 2015 and perform debugging using Diagnostic tools window.
In order to enable IntelliTrace in Visual Studio 2015, go to Tools -> Options and then select IntelliTrace

Check the Enable IntelliTrace option and select IntelliTrace events and call information. We should enable with the call information if we need to capture more detailed information like the name of the function, method and the parameters passed and the value returned back. This will however degrade the application performance.
Now click on the IntelliTrace Events to select the events you want to capture.

Now once you run the application in Debug mode it will start recording the events and you can see the Diagnostic tool window capturing the information as you use the application. This is very helpful when you don’t need to step into the code and putting break points on different statements rather, you can just enable the IntelliTrace and execute scenarios, and if some error happens, you will have the complete trace through which you can go to any event and through historical debugging exactly check what data has been passed and what happened in the background.
Let’s take a default login page example in which I will try to enter the username and password for two users and then we will step into the historical debugging based on the login events we had raised and see the values passed at each time.
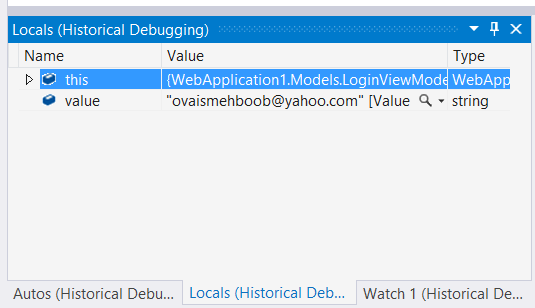
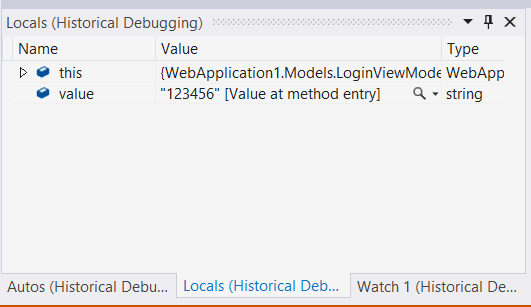
First I entered the following username

Then I entered my another email address and got the same invalid login attempt

Now, In order to check what happened we don’t need to apply the break points and reproduce the login attempts. However, I will just go to the Diagnostic tool window and check what values were passed and what happened.
IntelliTrace will record continuously until we hit break All from Visual Studio. So first hit break all, then open the Diagnostic Tools Window from Show Diagnostic Tool Window option on Visual Studio or through default shortcut i.e. Ctrl+Alt+F2

Filter only ASP.NET events from the category

Select POST “/Account/Login” and click on Activate Historical Debugging
We can step over and go to the Login method and in order to check what data has been passed we can go to the Locals (Historical Debugging) tab

Hope this helps!
